Introducing debug_request and debug_response
How Infron Transforms Your LLM Requests and Responses

Date
Author
Andrew Zheng
Imagine debugging a slow query where you can see the input and the result — but not the SQL your ORM actually ran. That's roughly how most LLM gateways work today.
You send a request. You get a response. Something looks off. Was it your prompt? Was it the gateway rewriting a parameter? Was it the upstream provider? Good luck.
Today we're shipping Request Preview and Response Preview: two new parameters — debug_request and debug_response — that make Infron's transformation layer fully inspectable. → [Docs]
Why Debugging an LLM Gateway Is Different
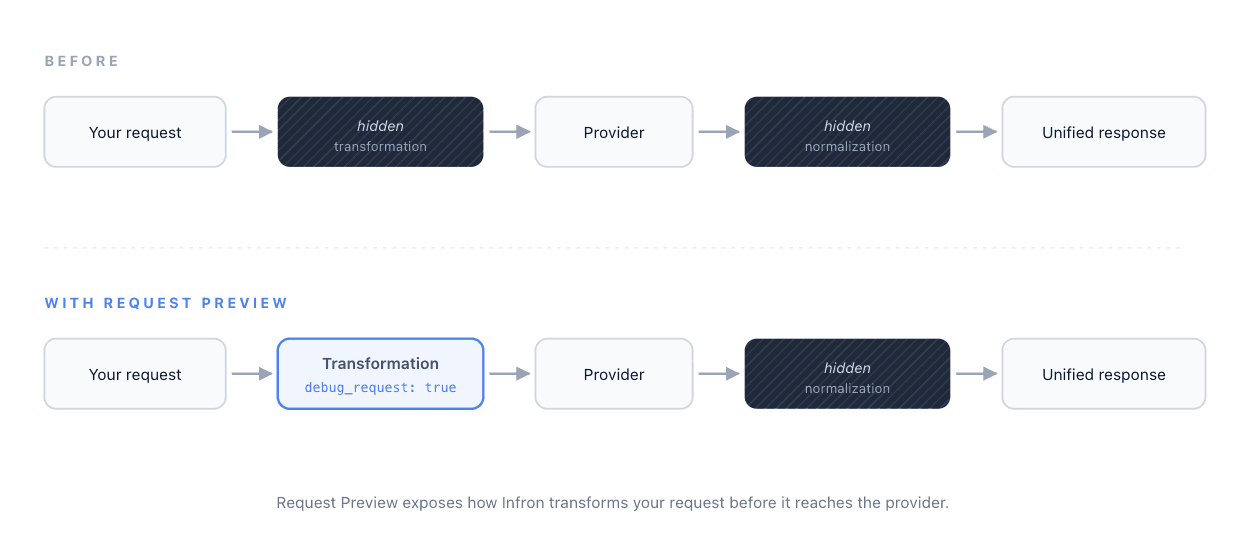
Traditional APIs are debuggable with status codes, logs, and stack traces. LLM calls are not. The effective behavior of a request is shaped by prompt structure, parameter mapping, provider-specific schemas, token accounting, and response normalization. When something goes wrong, the interesting stuff is almost always in the middle — and the middle is usually invisible.
Every gateway request follows the same chain:
Before today, you could only see the two ends. The two stages in between were black boxes. Now both are inspectable — one parameter for each direction.
Request Preview: See What Infron Sent Upstream
Set debug_request: true in your request body. Infron returns the full completion as usual — choices, usage, cost — and adds a debug_info.request object that contains the exact payload Infron prepared for the upstream provider:
debug_info.request.http.body— the transformed JSON body, after parameter mapping and schema normalizationdebug_info.request.http.body_raw— the raw body string, exactly as sent on the wiredebug_info.request.http.headers— the headers sent to the upstream providerdebug_info.request.http.method— the HTTP method useddebug_info.request.attempts— attempt metadata, including retries
Say you send this to Infron using the unified request format:
{
  "model": "claude-opus-4-7",
  "messages": [
    {
      "role": "user",
      "content": [
        { "type": "text", "text": "Explain quantum tunneling." }
      ]
{
  "model": "claude-opus-4-7",
  "messages": [
    {
      "role": "user",
      "content": [
        { "type": "text", "text": "Explain quantum tunneling." }
      ]
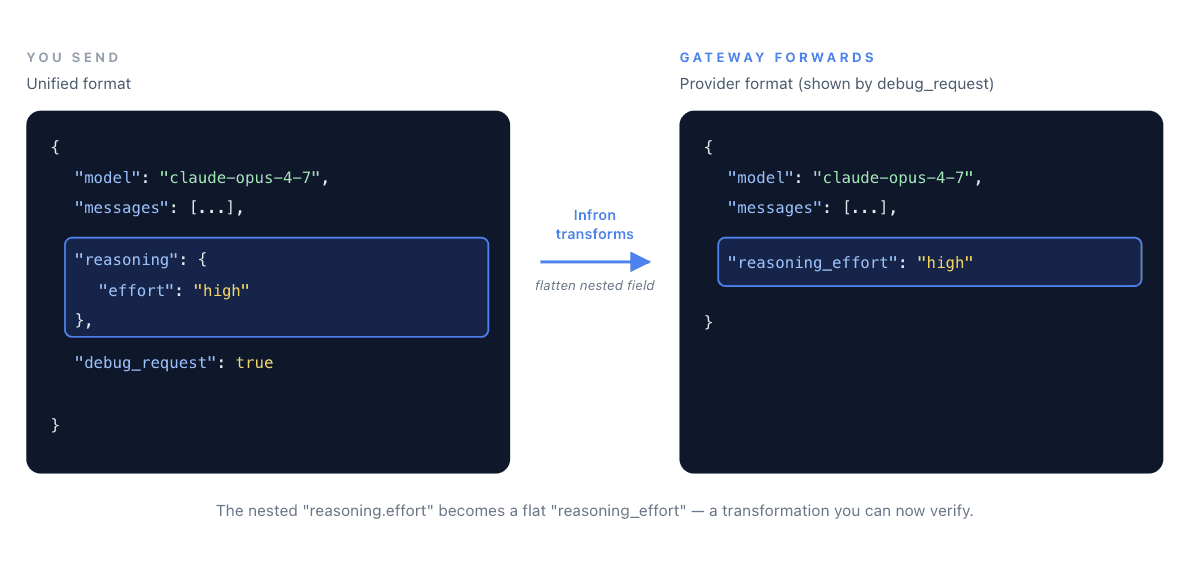
debug_info.request.http.body shows you what Infron actually forwarded upstream:
{
  "model": "claude-opus-4-7",
  "messages": [
    {
      "role": "user",
      "content": [
        { "type": "text", "text": "Explain quantum tunneling." }
      ]
{
  "model": "claude-opus-4-7",
  "messages": [
    {
      "role": "user",
      "content": [
        { "type": "text", "text": "Explain quantum tunneling." }
      ]
A nested reasoning object in the unified format became a flat reasoning_effort field in the provider payload. That's a transformation. You no longer have to guess whether it happened, or how.
Response Preview: See What the Provider Actually Returned
Request Preview answers "What did Infron send?" Response Preview answers the other half of the question: "What did the provider actually return?"
Set debug_response: true, and Infron adds a debug_info.response object with the raw upstream response — before any normalization:
debug_info.response.body— the provider's raw JSON response bodydebug_info.response.body_raw— the raw response string, exactly as receiveddebug_info.response.headers— the headers the provider returned, including timing metadata likeReq-Cost-TimeandX-Envoy-Upstream-Service-Timedebug_info.response.status_code— the HTTP status code from the provider
This closes the loop. When a response looks wrong, you can now see exactly where it became wrong:
Question | Look at |
|---|---|
Did my parameters reach the provider correctly? |
|
Did the provider return what I expected? |
|
Is the weirdness from Infron's normalization, or from the provider itself? | Compare |
Why was the call slow? |
|
Use them independently, or pass both in the same request for a full-chain view.
Where This Saves You Time
Migrating from a direct provider integration. You've been calling Anthropic or OpenAI directly. You switch to Infron. Something behaves slightly differently. debug_request tells you — in one call — whether the gateway forwarded your payload the way you expected, and debug_response tells you whether the normalization preserved what the provider sent back.
Debugging silently-dropped parameters and fields. You passed seed, top_p, reasoning.effort, or any other parameter. Did the provider actually get it? Did it return reasoning_content that got lost somewhere? The two previews end the guessing on both ends.
Isolating failure domains. A response looks malformed. Is it Infron's normalization, or did the provider return it that way? debug_info.response.body shows you the raw upstream payload, so you can tell the difference in seconds instead of minutes.
Analyzing upstream latency. The timing headers in debug_info.response.headers let you break down where time is actually being spent — useful when a 3-second response might be the model, or might be network.
Reproducing production issues. A user reports weird output. You re-run with both parameters enabled and get a complete trace of every transformation — without touching a single log file.
What This Doesn't Do
These are inspection tools, not interception tools. The request is still sent upstream, tokens are still charged, and the provider still runs — this is visibility into the transformation layer, not a simulation mode. If you want a true "plan, don't execute" mode, tell us; that's a different feature.
They also don't fix anything on their own. Request and Response Preview give you visibility. What you do with that visibility is up to you.
Why We're Building This
A lot of what an LLM gateway does happens behind a curtain — that's literally what "abstraction" means. But when abstractions fail silently, developers stop trusting them. And a gateway you don't trust is worse than no gateway at all.
We'd rather build a gateway you can look inside. Request Preview and Response Preview are the first step. There will be more.
Try It
Both debug_request and debug_response are live now across supported models. → [Docs]
If you hit an edge case — a parameter that's getting mangled, a field that's going missing, a transformation that looks wrong — send it to us. We'd like to see it.
Imagine debugging a slow query where you can see the input and the result — but not the SQL your ORM actually ran. That's roughly how most LLM gateways work today.
You send a request. You get a response. Something looks off. Was it your prompt? Was it the gateway rewriting a parameter? Was it the upstream provider? Good luck.
Today we're shipping Request Preview and Response Preview: two new parameters — debug_request and debug_response — that make Infron's transformation layer fully inspectable. → [Docs]
Why Debugging an LLM Gateway Is Different
Traditional APIs are debuggable with status codes, logs, and stack traces. LLM calls are not. The effective behavior of a request is shaped by prompt structure, parameter mapping, provider-specific schemas, token accounting, and response normalization. When something goes wrong, the interesting stuff is almost always in the middle — and the middle is usually invisible.
Every gateway request follows the same chain:
Before today, you could only see the two ends. The two stages in between were black boxes. Now both are inspectable — one parameter for each direction.
Request Preview: See What Infron Sent Upstream
Set debug_request: true in your request body. Infron returns the full completion as usual — choices, usage, cost — and adds a debug_info.request object that contains the exact payload Infron prepared for the upstream provider:
debug_info.request.http.body— the transformed JSON body, after parameter mapping and schema normalizationdebug_info.request.http.body_raw— the raw body string, exactly as sent on the wiredebug_info.request.http.headers— the headers sent to the upstream providerdebug_info.request.http.method— the HTTP method useddebug_info.request.attempts— attempt metadata, including retries
Say you send this to Infron using the unified request format:
{
  "model": "claude-opus-4-7",
  "messages": [
    {
      "role": "user",
      "content": [
        { "type": "text", "text": "Explain quantum tunneling." }
      ]
debug_info.request.http.body shows you what Infron actually forwarded upstream:
{
  "model": "claude-opus-4-7",
  "messages": [
    {
      "role": "user",
      "content": [
        { "type": "text", "text": "Explain quantum tunneling." }
      ]
A nested reasoning object in the unified format became a flat reasoning_effort field in the provider payload. That's a transformation. You no longer have to guess whether it happened, or how.
Response Preview: See What the Provider Actually Returned
Request Preview answers "What did Infron send?" Response Preview answers the other half of the question: "What did the provider actually return?"
Set debug_response: true, and Infron adds a debug_info.response object with the raw upstream response — before any normalization:
debug_info.response.body— the provider's raw JSON response bodydebug_info.response.body_raw— the raw response string, exactly as receiveddebug_info.response.headers— the headers the provider returned, including timing metadata likeReq-Cost-TimeandX-Envoy-Upstream-Service-Timedebug_info.response.status_code— the HTTP status code from the provider
This closes the loop. When a response looks wrong, you can now see exactly where it became wrong:
Question | Look at |
|---|---|
Did my parameters reach the provider correctly? |
|
Did the provider return what I expected? |
|
Is the weirdness from Infron's normalization, or from the provider itself? | Compare |
Why was the call slow? |
|
Use them independently, or pass both in the same request for a full-chain view.
Where This Saves You Time
Migrating from a direct provider integration. You've been calling Anthropic or OpenAI directly. You switch to Infron. Something behaves slightly differently. debug_request tells you — in one call — whether the gateway forwarded your payload the way you expected, and debug_response tells you whether the normalization preserved what the provider sent back.
Debugging silently-dropped parameters and fields. You passed seed, top_p, reasoning.effort, or any other parameter. Did the provider actually get it? Did it return reasoning_content that got lost somewhere? The two previews end the guessing on both ends.
Isolating failure domains. A response looks malformed. Is it Infron's normalization, or did the provider return it that way? debug_info.response.body shows you the raw upstream payload, so you can tell the difference in seconds instead of minutes.
Analyzing upstream latency. The timing headers in debug_info.response.headers let you break down where time is actually being spent — useful when a 3-second response might be the model, or might be network.
Reproducing production issues. A user reports weird output. You re-run with both parameters enabled and get a complete trace of every transformation — without touching a single log file.
What This Doesn't Do
These are inspection tools, not interception tools. The request is still sent upstream, tokens are still charged, and the provider still runs — this is visibility into the transformation layer, not a simulation mode. If you want a true "plan, don't execute" mode, tell us; that's a different feature.
They also don't fix anything on their own. Request and Response Preview give you visibility. What you do with that visibility is up to you.
Why We're Building This
A lot of what an LLM gateway does happens behind a curtain — that's literally what "abstraction" means. But when abstractions fail silently, developers stop trusting them. And a gateway you don't trust is worse than no gateway at all.
We'd rather build a gateway you can look inside. Request Preview and Response Preview are the first step. There will be more.
Try It
Both debug_request and debug_response are live now across supported models. → [Docs]
If you hit an edge case — a parameter that's getting mangled, a field that's going missing, a transformation that looks wrong — send it to us. We'd like to see it.
More Articles

Sticky Routing
Sticky Routing: Your Cache Hit Rate Is a Routing Problem
Sticky Routing
Sticky Routing: Your Cache Hit Rate Is a Routing Problem

Seedance 2.0 Real Human Pipeline
How to Build a Seedance 2.0 Real Human Pipeline With Reference Images
Seedance 2.0 Real Human Pipeline
How to Build a Seedance 2.0 Real Human Pipeline With Reference Images

From Image Model to Finished Clip
Seedance 2.0 Real Human Video API: Access, Setup, and Prompting
From Image Model to Finished Clip
Seedance 2.0 Real Human Video API: Access, Setup, and Prompting
Less orchestration.
More innovation.
Seamlessly integrate Infron with just a few lines of code and unlock unlimited AI power.
Less orchestration.
More innovation.
Seamlessly integrate Infron with just a few lines of code and unlock unlimited AI power.
Less orchestration.
More innovation.
Seamlessly integrate Infron with just a few lines of code and unlock unlimited AI power.